Here are my first lines about how investigating on our production network.
One of my tasks in my current job is to do some "network forensic".
 |
| As a CSI agent :) picture from http://www.critikeurs.fr/wp-content/uploads/2010/06/CSI.jpg |
As a CSI agent with a crime, we have to investigate and find the cause of some network problems: link down, bad performance or lost packets (in trading rooms, the packet loss may even be more critical, it is hard to believe that banks can lose a lot of money by losing a packet).
To be able to provide a cause to network problems, here some clues to check:
- Logs checking
This can be SNMP traps, SYSLOG messages sent from the faulty devices or impacted devices to a centralized log collector. It is also possible to check the logs on the devices.
To be useful, all devices need to be synchronized on a common time source (NTP, PTP, or any others ways to get clock synchronization) and some filtering on the logging to gain time (is it relevant to get SNMP messages from interfaces dedicated to users, when you know these interfaces can sent SNMP traps?). swatch is a nice tool to filter syslog messages.
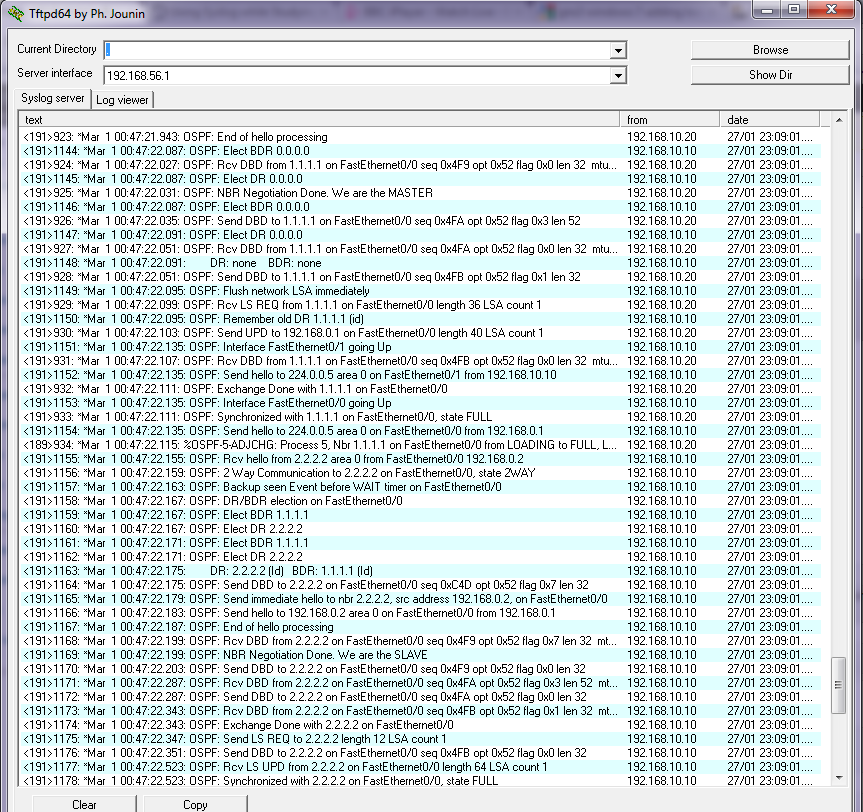 |
| View of a SYSLOG server (here tftp-64) picture from http://www.devilwah.com/wp-content/uploads/2012/01/Syslog.png |
- Monitoring systems
By consulting data stored in monitoring systems, it possible to know different values retrieved at regular basis through SNMP. Most of these values are counters : RX errors counter - TX errors counter - RX discard counter - TX discard counter - In Bytes - Out Bytes ...
These values can be return as simple value, and they can be represented on a graph. It is also possible to define threshold value to send alerts or to perform any predefined actions.
Cacti is a well-know monitoring system, produce nice graphs and can get new modules.
And I'm currently working on a new one : Statseeker. Graphs are not nicer than on Cacti, but it is easy to configure. But it is a licensed product.
 |
| Some graphs from Cacti picture from http://www.cacti.net/image.php?image_id=43 |
- Packet analysis
This is the most efficient way to see if there is any packet loss. To do that, some packet captures have to be done: closest as possible to the source and the destination is the way to get the packet loss (simple difference between the capture files), in critical points (close to backbone routers, or at the network edge).
The main drawback is the memory consumption, doing a packet capture requires to be able to store the packets. It is possible to save memory by defining filters in pre-capture, but the filtered packets won't be saved. Use dedicated packet collectors can solved this point, they're dedicated to store packets.
Wireshark is one of the most known tool for packet analysis and capture.
But since few months now, I'm using Cascade Pilot (a licensed product) for packet analysis.
And finally, the most obvious, it is to ask details from impacted users : What is the problem ? When does it occur?
It's not perfect, but these points are the starting point to troubleshoot network performance problems
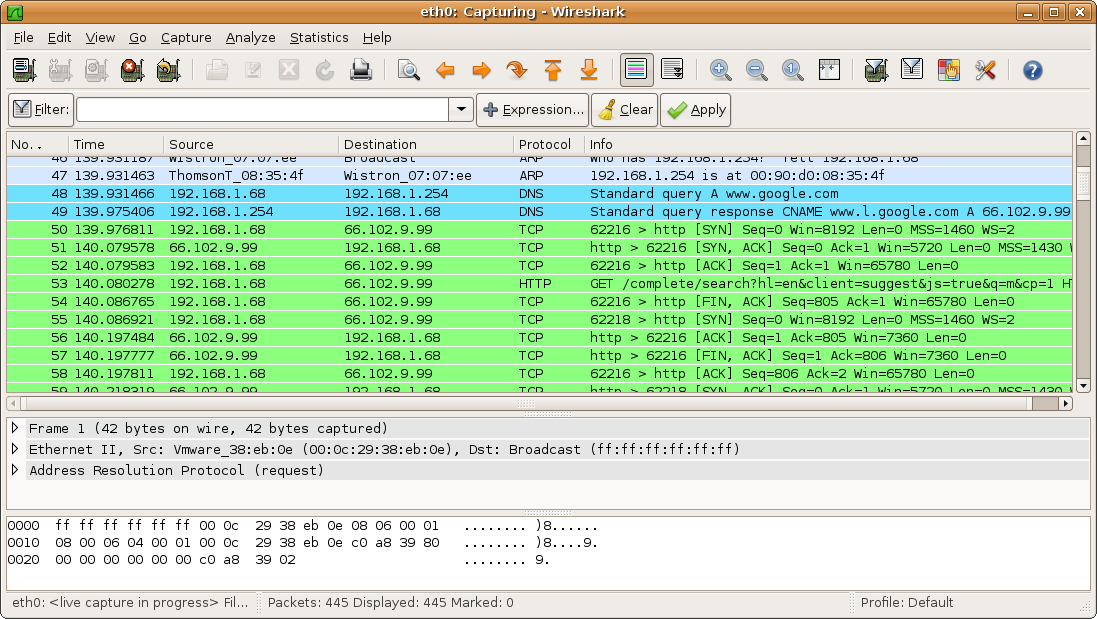 |
| Wireshark Console picture from http://upload.wikimedia.org/wikipedia/commons/0/03/Wireshark_screenshot.png |
And finally, the most obvious, it is to ask details from impacted users : What is the problem ? When does it occur?
It's not perfect, but these points are the starting point to troubleshoot network performance problems
More infos :
No comments:
Post a Comment